Introduction
The global electroweak fit tests the quantum structure of the Standard Model by confronting precision measurements with high-order theoretical predictions. It demonstrates impressively the predictive power of electroweak unification and quantum loop corrections. We have performed the fit using the most recent experimental measurements and state-of-the-art SM predictions. More details can be found in our latest publicationThe Higgs boson through the lens of electroweak precision data .
Experimental input
The fit uses the masses and widths of the Z and W bosons, the Higgs-boson mass, the top-quark mass, the effective leptonic weak mixing angle, the strong coupling constant, the hadronic contribution to the running electromagnetic coupling, and the Z-pole observables measured at LEP and SLC. Compared to our previous analysis, the most important updates come from the latest LHC measurements:
- For the W-boson mass we use the May 2026 update of the LHC-Tevatron MW Working Group combination, MW = 80.3625 ± 0.0077 GeV, which includes measurements from ATLAS, CMS, LHCb, D0 and LEP, all evaluated with the CT18 PDF set.
- The W-boson width was measured for the first time at the LHC by ATLAS, ΓW = 2.202 ± 0.047 GeV, currently the single most precise determination. We use the weighted average of the ATLAS, LEP and Tevatron results, ΓW = 2.14 ± 0.05 GeV.
- The effective leptonic weak mixing angle from hadron colliders is combined by us into a single fit input, sin2θeffl(HC) = 0.23149 ± 0.00021, using the Tevatron combination together with measurements from ATLAS at 7 and 8 TeV, CMS at 8 and 13 TeV, and LHCb at 7, 8 and 13 TeV. These have become competitive with the precision reached at lepton colliders.
- The Higgs-boson mass average MH = 125.13 ± 0.11 GeV includes the ATLAS and CMS Run-1 combination, the ATLAS Run-2 combination and the CMS Run-2 measurements in the H→γγ and H→ZZ*→4l channels.
- For the top-quark mass we use the ATLAS and CMS Run-1 combination, mt = 172.52 ± 0.33 (exp) ± 0.50 (theo) GeV, where the second uncertainty accounts for the ambiguity in relating the measured mass to the top-quark pole mass.
- The Z-boson mass world average MZ = 91.1879 ± 0.0020 GeV combines the LEP result with more recent measurements from CDF and LHCb. The hadronic peak cross section, σ0had = 41.480 ± 0.033 nb, is updated for the improved Bhabha cross section and for a newer calculation of beam-beam effects relevant to the LEP luminosity measurement.
- The strong coupling constant is now also used as an external input to the nominal fit, αs(MZ2) = 0.1177 ± 0.0009, because the new precise LHC measurements of MW challenge the theoretical predictions and therefore require the smallest possible parametric uncertainties. This does not replace our own determination: αs continues to be determined from the fit, and the result obtained without the external constraint is given below.
Theoretical predictions
For the following results the latest theoretical predictions of electroweak observables are used. They include the most precise higher-order radiative corrections available in the literature and are implemented in the on-shell renormalisation scheme through semi-analytical parametrisations. In particular:
- The mass of the W boson (MW) is obtained from the on-shell relation connecting MW to the Fermi constant GF through the radiative corrections Δr. We use the parametrisation of (M. Awramik et al., Phys. Rev. D69, 053006 (2004), hep-ph/0311148), based on the complete electroweak two-loop result and supplemented by the known three- and four-loop QCD corrections.
- The effective weak mixing angle (sin2θfeff) is calculated
with the complete electroweak two-loop corrections, including the bosonic two-loop corrections
to the Zbb vertex, as well as partial higher-order QCD corrections and the leading
top-mass-enhanced terms. We use the parametrisations of
(I. Dubovyk et al., JHEP 08, 113 (2019), arXiv:1906.08815) for charged leptons and b quarks, and
(M. Awramik et al., JHEP 0611, 048 (2006), hep-ph/0608099) for the other fermions. - The partial and total widths of the Z boson and the hadronic peak cross section are computed including the complete fermionic electroweak two-loop corrections and the leading bosonic two-loop contributions, together with the dominant final-state QED and QCD radiation. We use the parametrisations of (I. Dubovyk et al., JHEP 08, 113 (2019), arXiv:1906.08815), cross-checked against the earlier parametrisations of (A. Freitas, JHEP 1404, 070 (2014), arXiv:1401.2447).
- The total width of the W boson is known at one electroweak loop order, and we use the parametrisation of (Cho et al., JHEP 1111, 068 (2011), arXiv:1104.1769). The corresponding theoretical uncertainty remains well below the experimental precision.
- QCD corrections to the electroweak precision observables are known up to O(αs4) for the dominant non-singlet contribution (P. A. Baikov et al., Phys. Rev. Lett. 101, 012002 (2008), arXiv:0801.1821) and for the smaller singlet contributions (P. A. Baikov et al., Phys. Rev. Lett. 108, 222003 (2012), arXiv:1201.5804).
- Theoretical uncertainties from missing higher-order corrections are included in the fit as Gaussian nuisance parameters. The prediction of MW is assigned an uncertainty of 4 MeV, and the effective weak mixing angle 4.3·10-5 for charged leptons and 5.3·10-5 for b quarks. The latter is 9% smaller than in our previous analysis, owing to the updated two-loop calculation.
Fit results of the current global fit
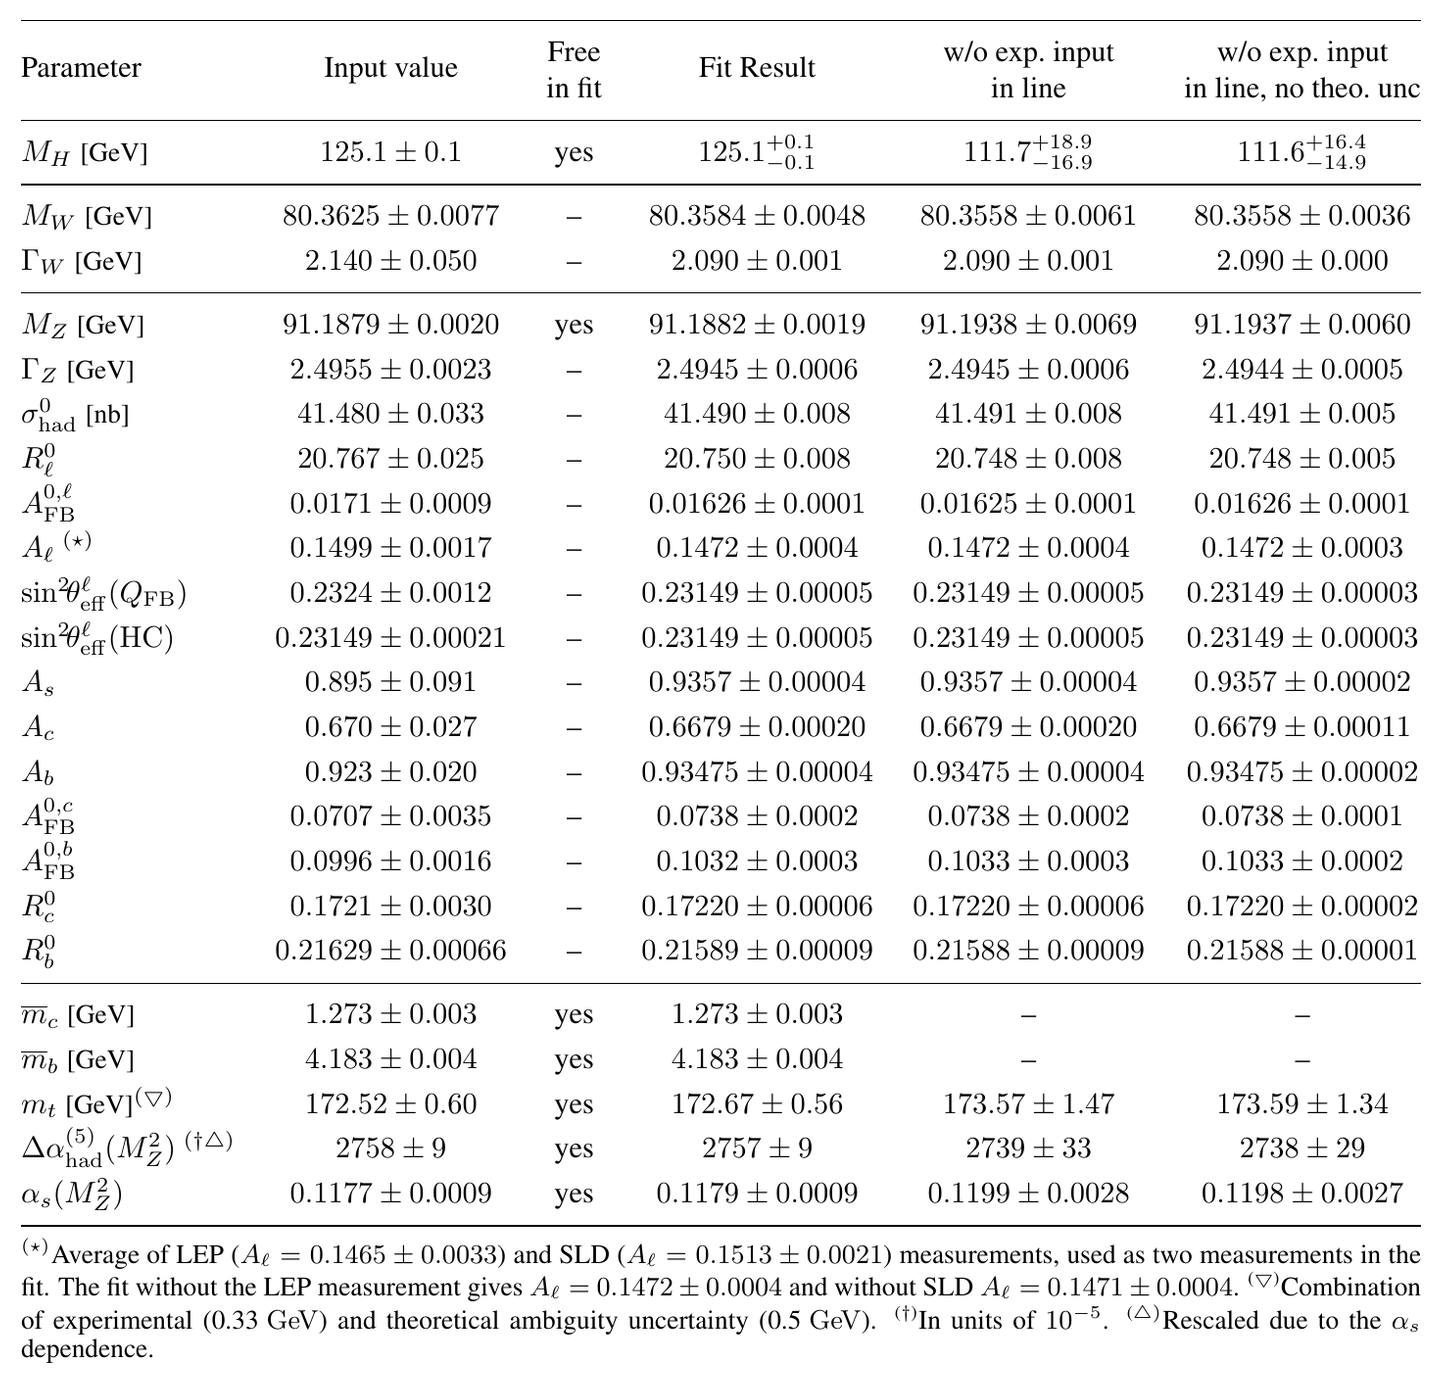
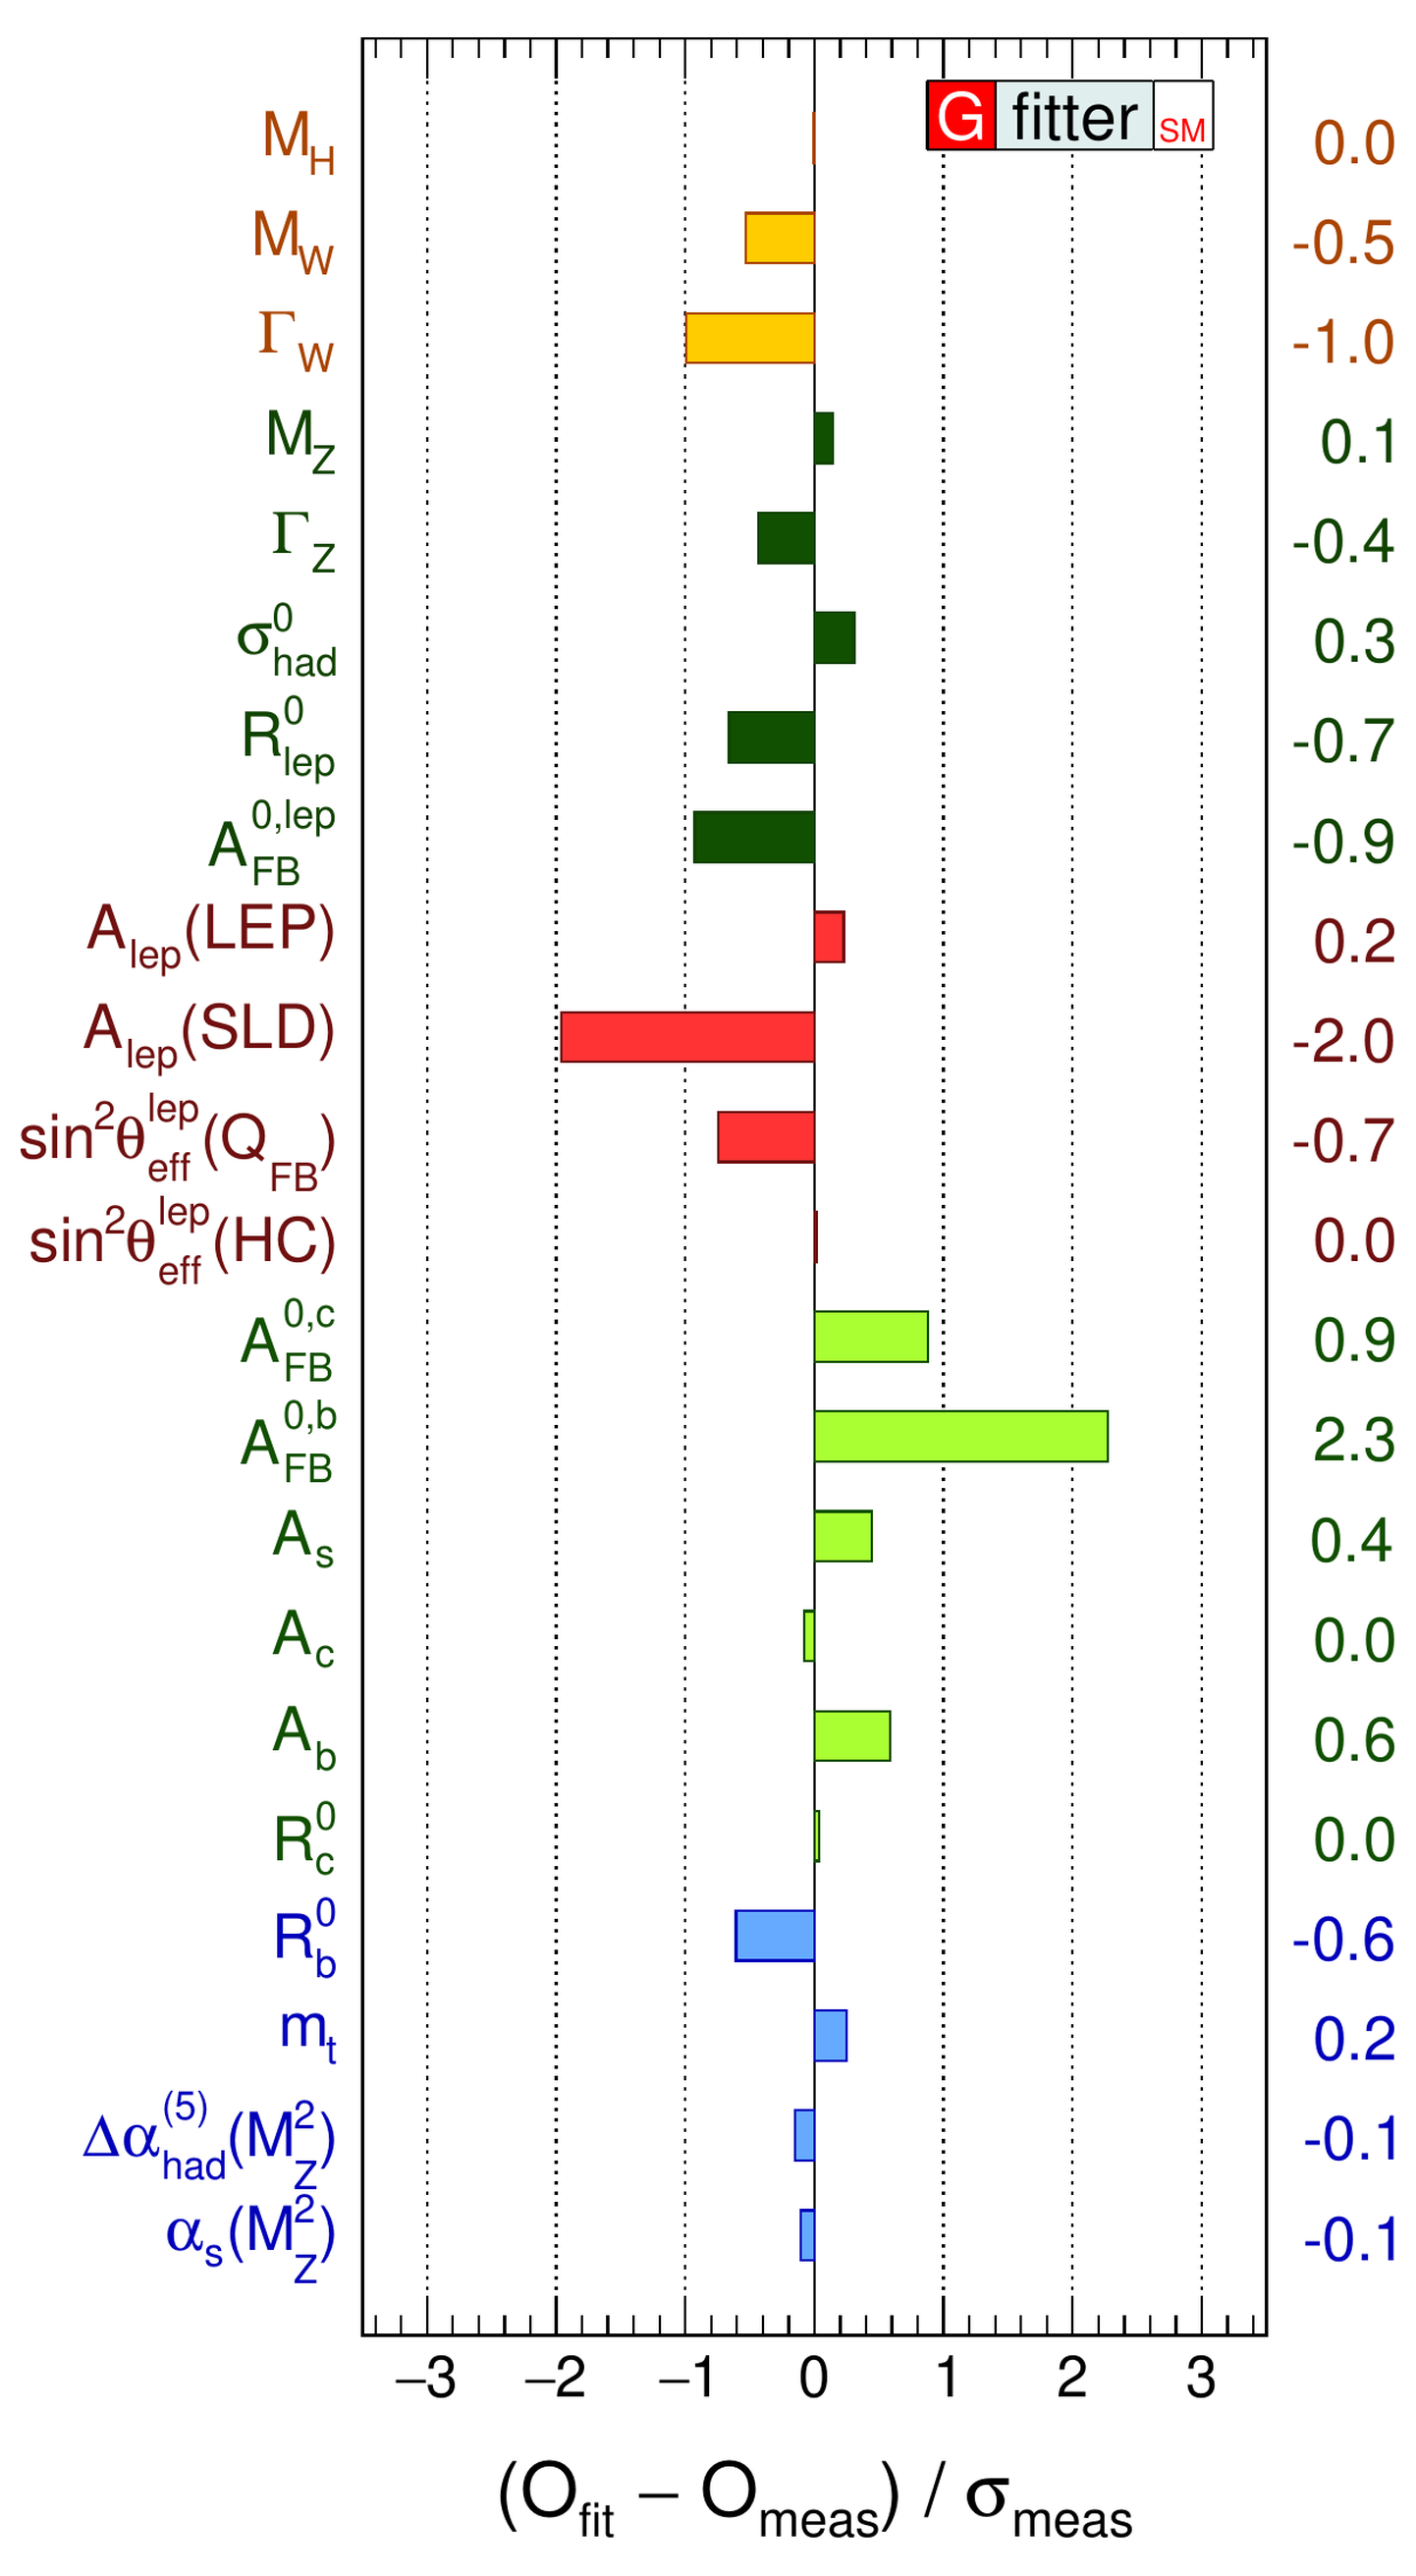
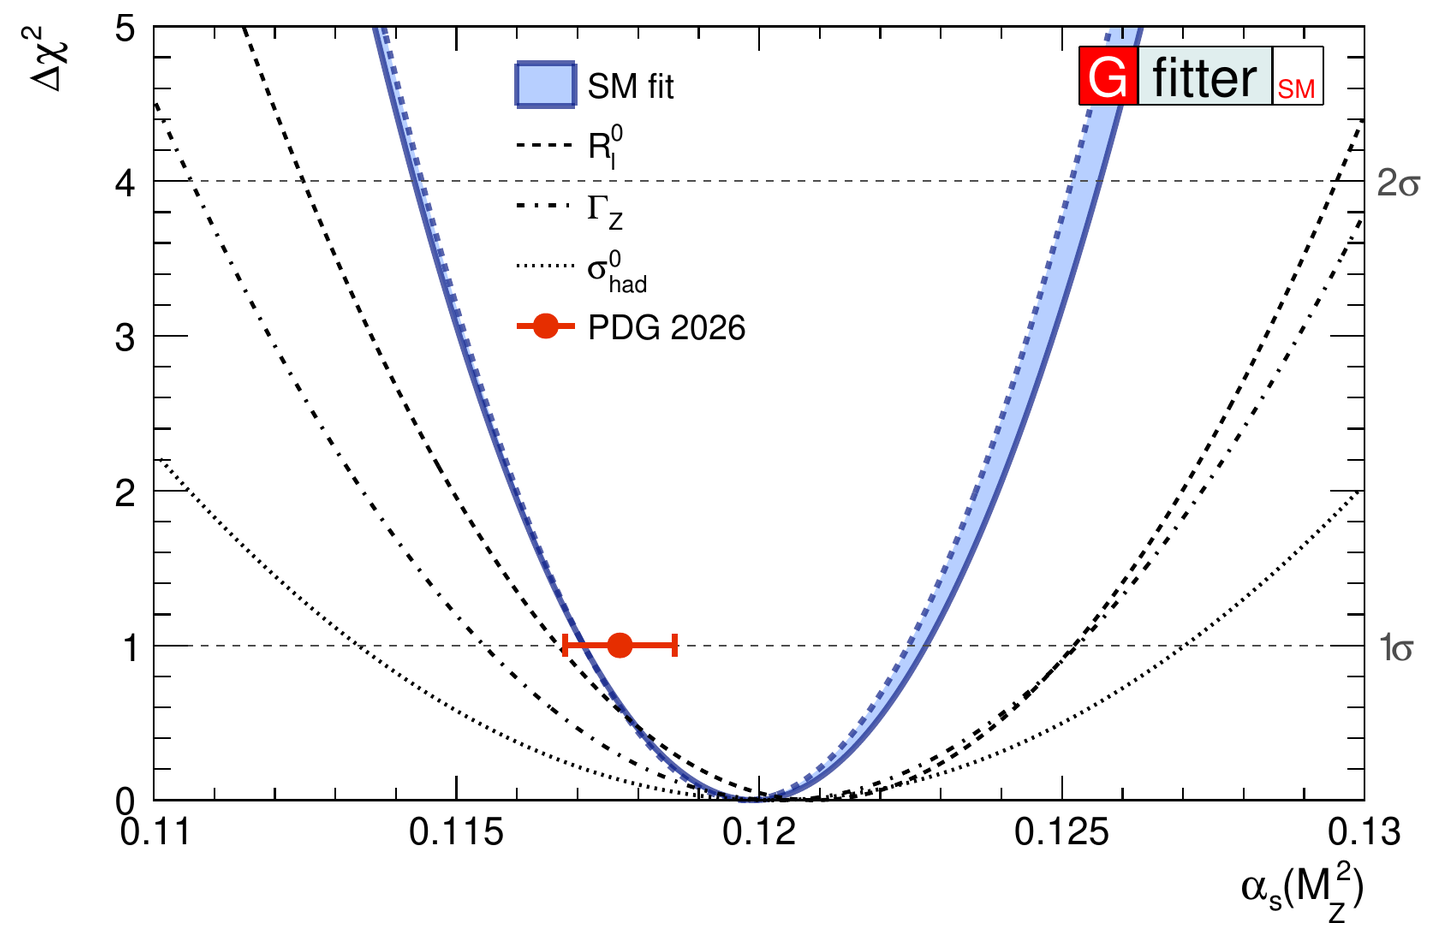
In the following tables and figures the experimental input used in the fit and the fit results are given. All fits discussed here minimise the test statistics χ2 which accounts for the deviations between the observables given in the table below and their SM predictions. The fit converges at the global minimum value χ2min =13.8 for 17 degrees of freedom, giving the p-value Prob(χ2min,17)=0.68, improving on our previous result of χ2min =18.6 for 15 degrees of freedom and p=0.23. This improvement is driven by the combined LHC measurements of MW and sin2θeffl, the updated value of σ0had, and the completed full two-loop calculations of the electroweak precision observables. It is notable given that some key measurements have uncertainties reduced by up to a factor of two compared with our previous analysis. The largest tension is observed in the forward-backward asymmetry of b quarks, A0,bFB, with a pull of 2.3σ, followed by the leptonic asymmetry parameter Al(SLD) with a pull of -2.0σ. All other observables are reproduced within about one standard deviation. The pull of ΓW has changed from 0.1σ in our previous fit to -1.0σ as a consequence of the ATLAS measurement. The indirect determination of the W-boson mass reads MW = 80.3558 ± 0.0061 GeV. It agrees with the measurement combination, 80.3625 ± 0.0077 GeV, within 0.7σ, and is almost matched in precision. The fit also determines the strong coupling constant at the Z-mass scale, with full electroweak NNLO and O(αs4) QCD accuracy, to be αs(MZ2) = 0.1199 ± 0.0028, obtained without the external αs constraint. The most sensitive observables are R0l, ΓZ and σ0had, and theoretical uncertainties have little impact on this determination.| Table: Input values and fit results for the observables and parameters of the global electroweak fit. The first and second columns list respectively the observables/parameters used in the fit, and their experimental values or phenomenological estimates. The third column indicates whether a parameter is floating in the fit. The fourth column quotes the results of the complete fit including all experimental data. In the fifth column the fit results are given without using the corresponding experimental or phenomenological estimate in the given row. The last column shows the results ignoring all theoretical uncertainties. |
 .pdf
.pdf
|
| Pulls in the global electroweak fit, defined as the full-fit result minus the input measurement, in units of the measurement uncertainty. |
 .pdf
.pdf
|
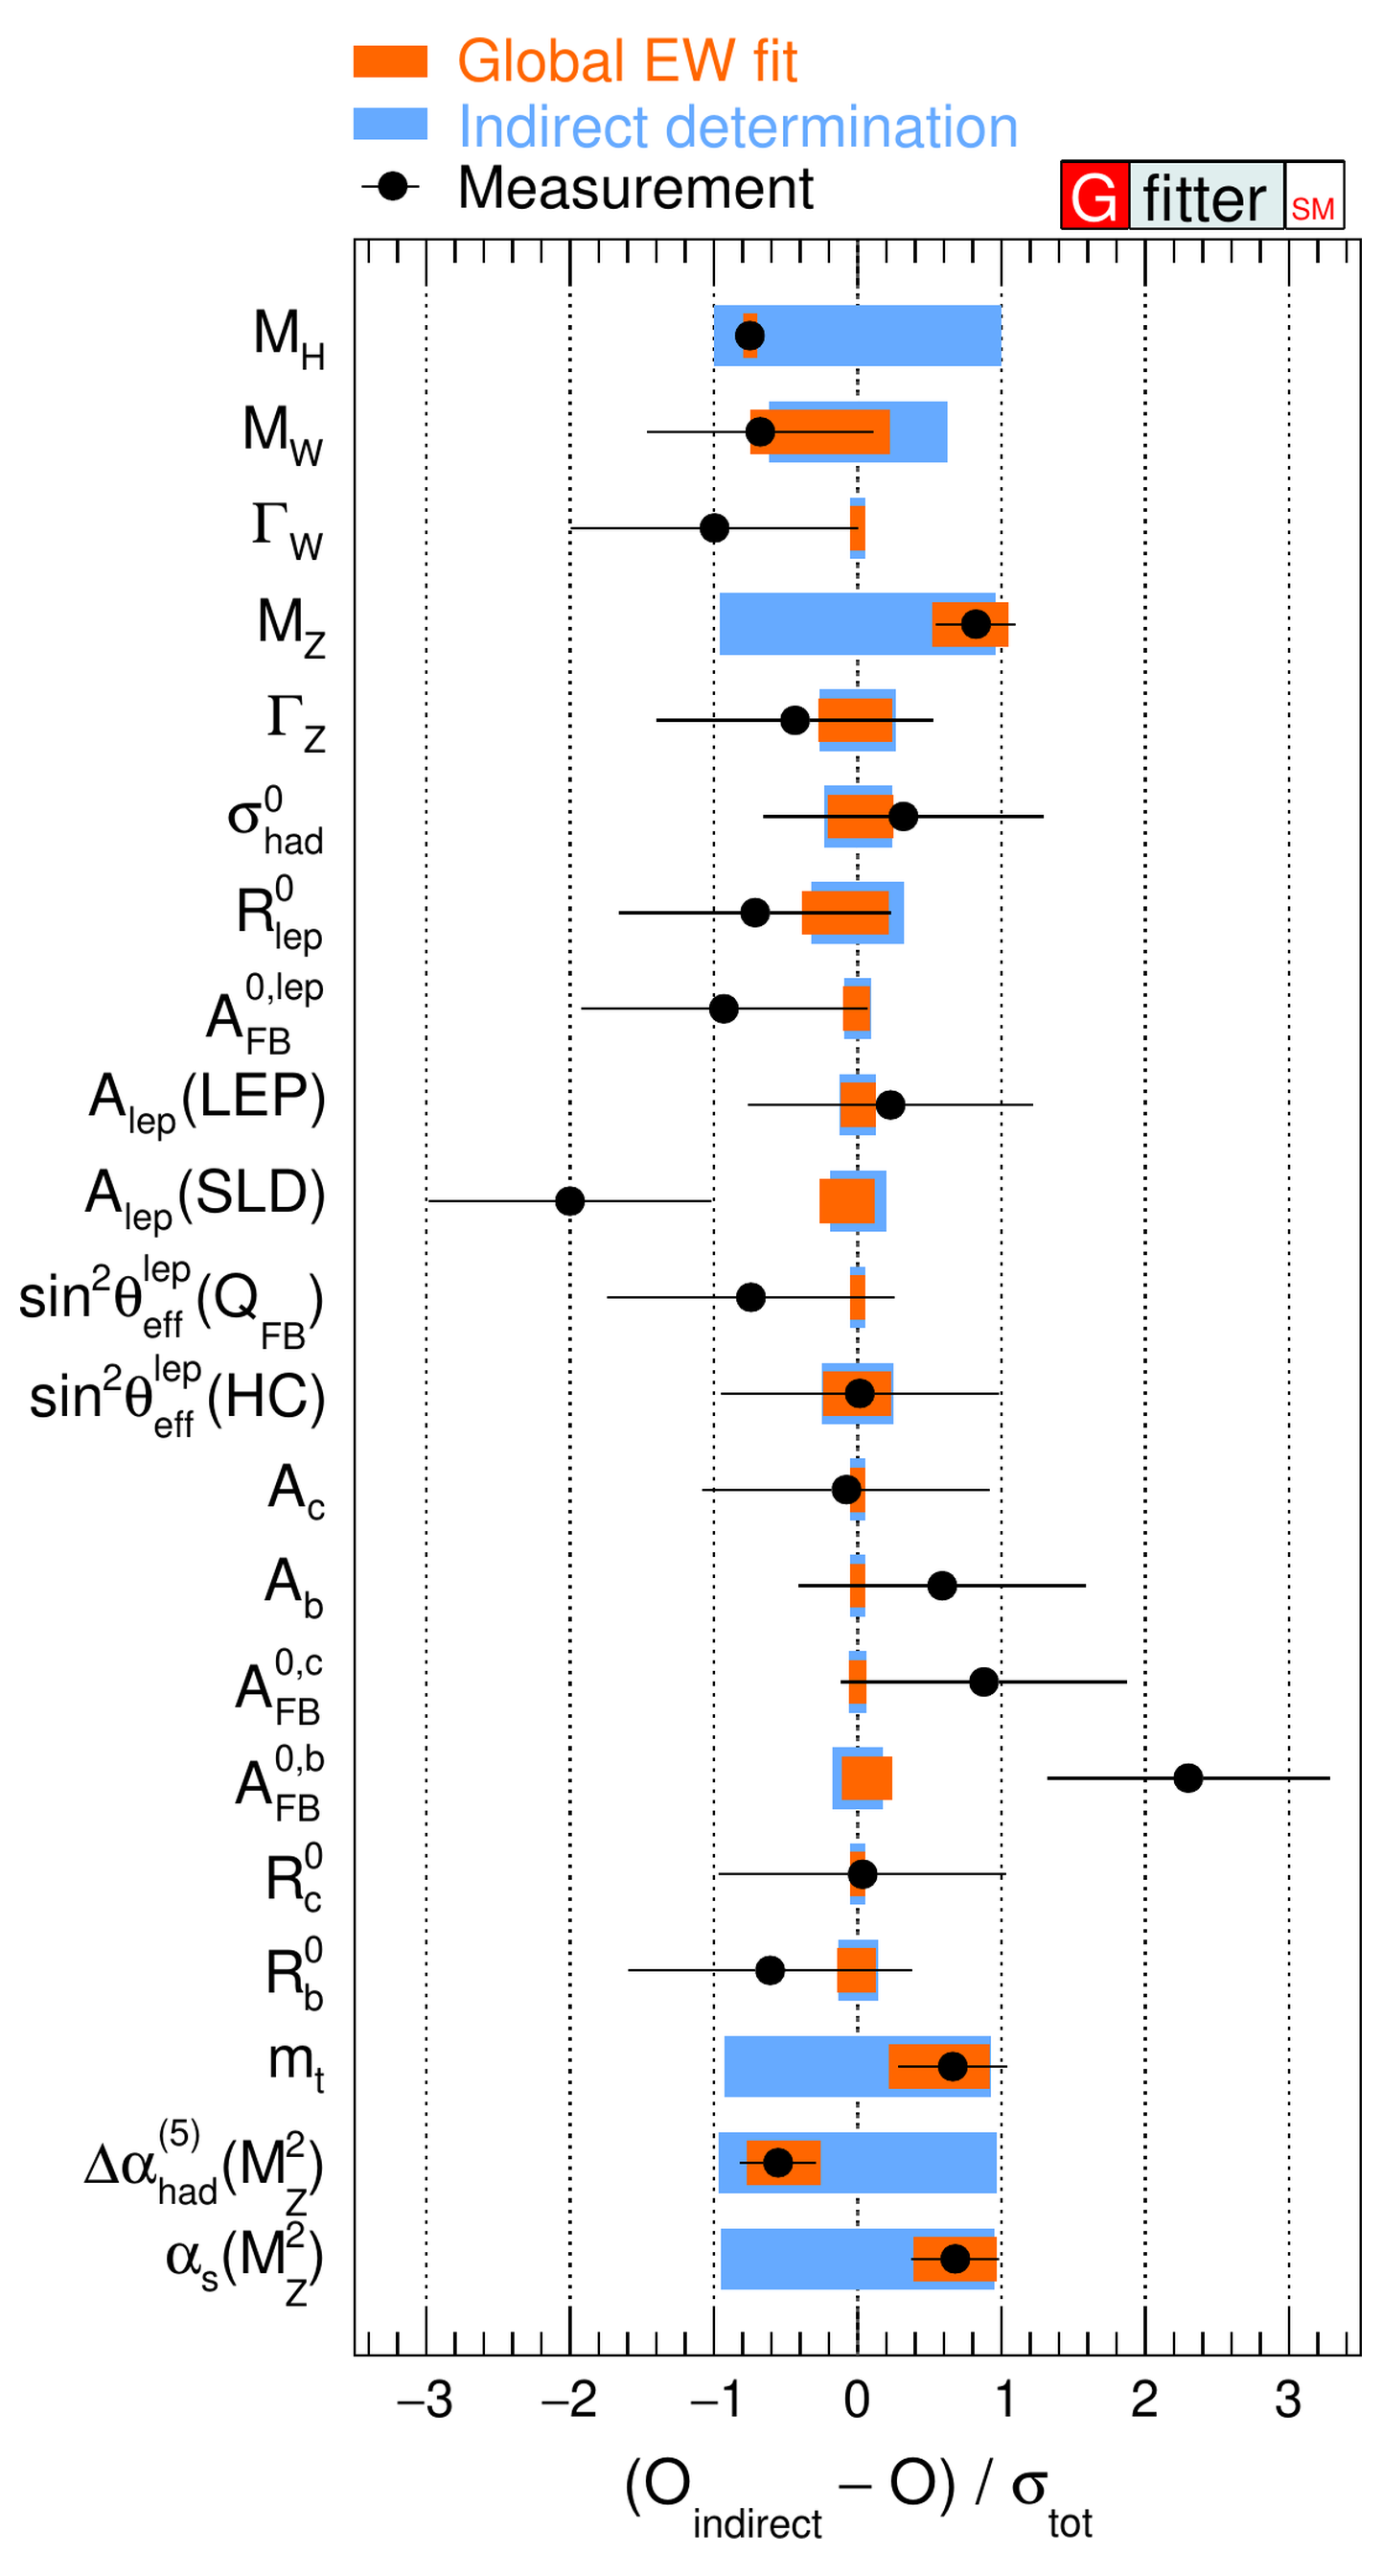
| Comparing fit results (orange bars) with indirect determinations (blue bars) and direct measurements (data points): pull values for the SM fit defined as deviations to the indirect determinations. The total error is taken to be the error of the direct measurement added in quadrature with the error from the indirect determination. This plot is a graphical representation of the numbers presented in the above table. |
 .pdf
.pdf
|
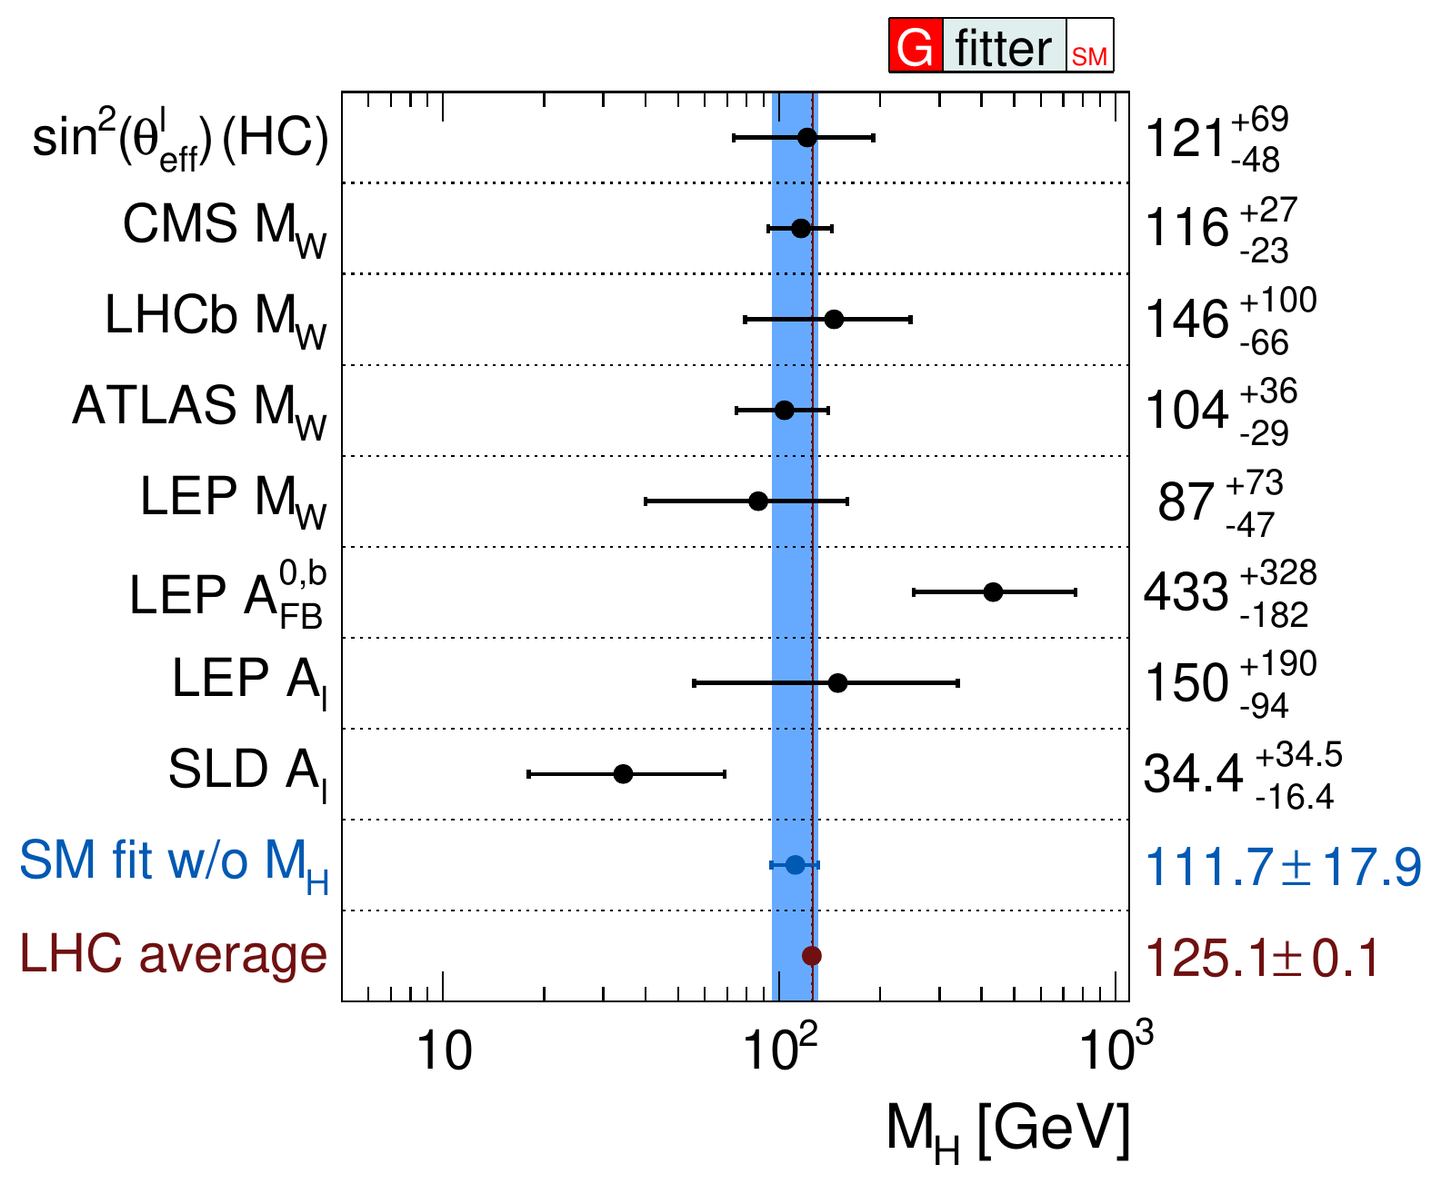
| Determination of MH excluding all the sensitive observables from the fit, except for the one given. |
 .pdf
.pdf
|
| Δχ2 as a function of the running strong coupling at MZ, obtained without the external αs constraint. The blue band shows the full-fit result, with its width indicating the contribution from theoretical uncertainties; solid and dotted lines correspond to fits with and without these uncertainties. The grey lines show the determinations from R0l, ΓZ and σ0had alone. The external input value used in the nominal fit is shown for comparison. |
 .pdf
.pdf
|
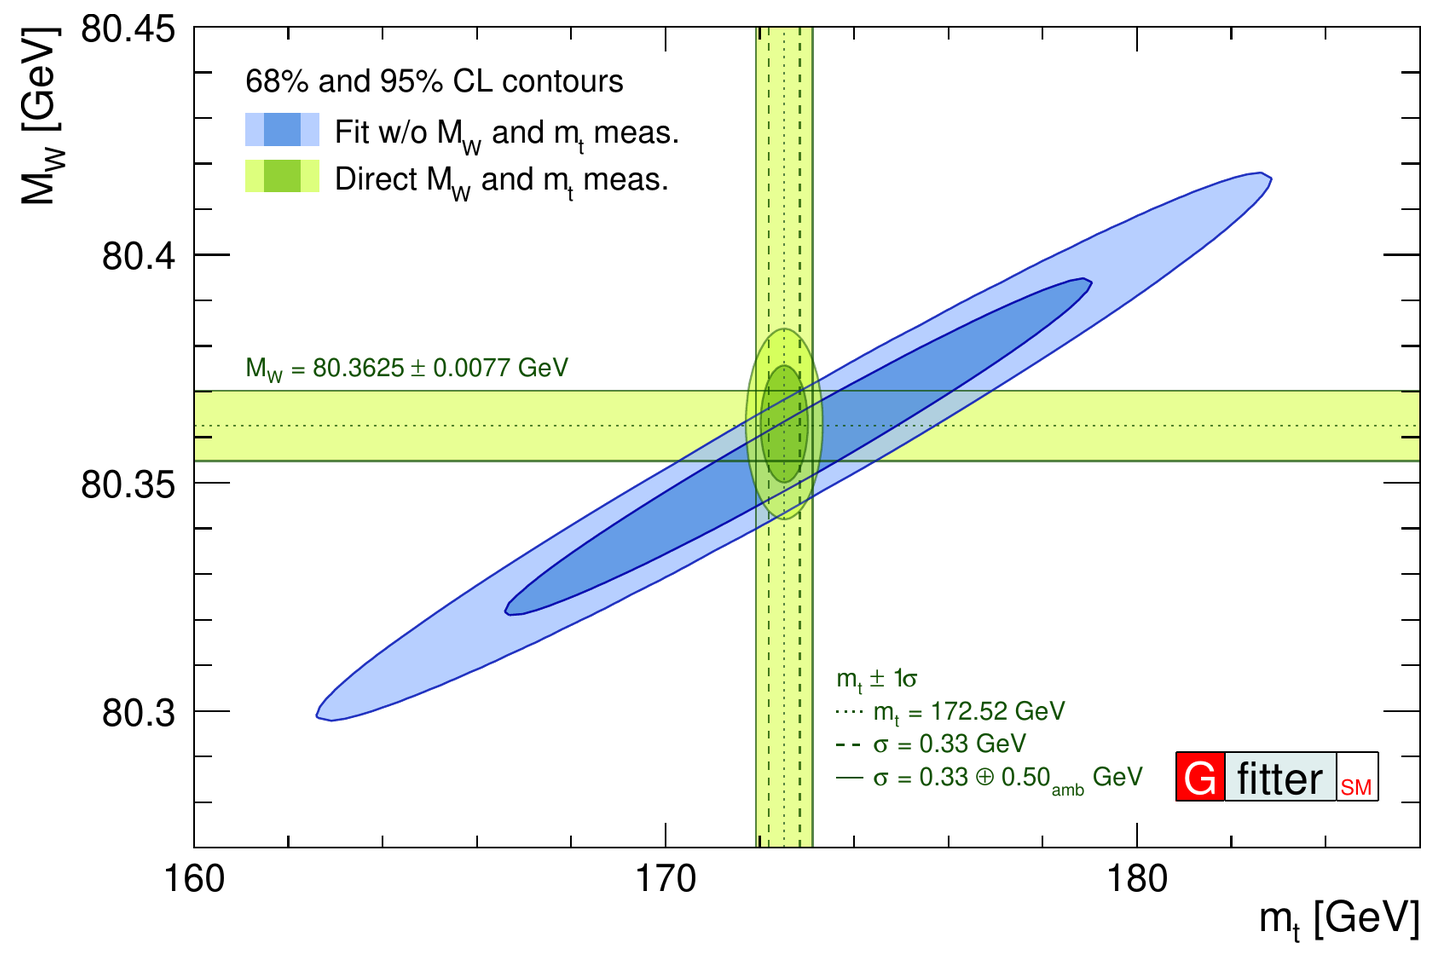
| Indirect fit determination of mt and MW (blue), compared with the experimental values (green). The 68% and 95% confidence-level contours are shown. This is the version included in our publication. |
 .pdf
.pdf
|
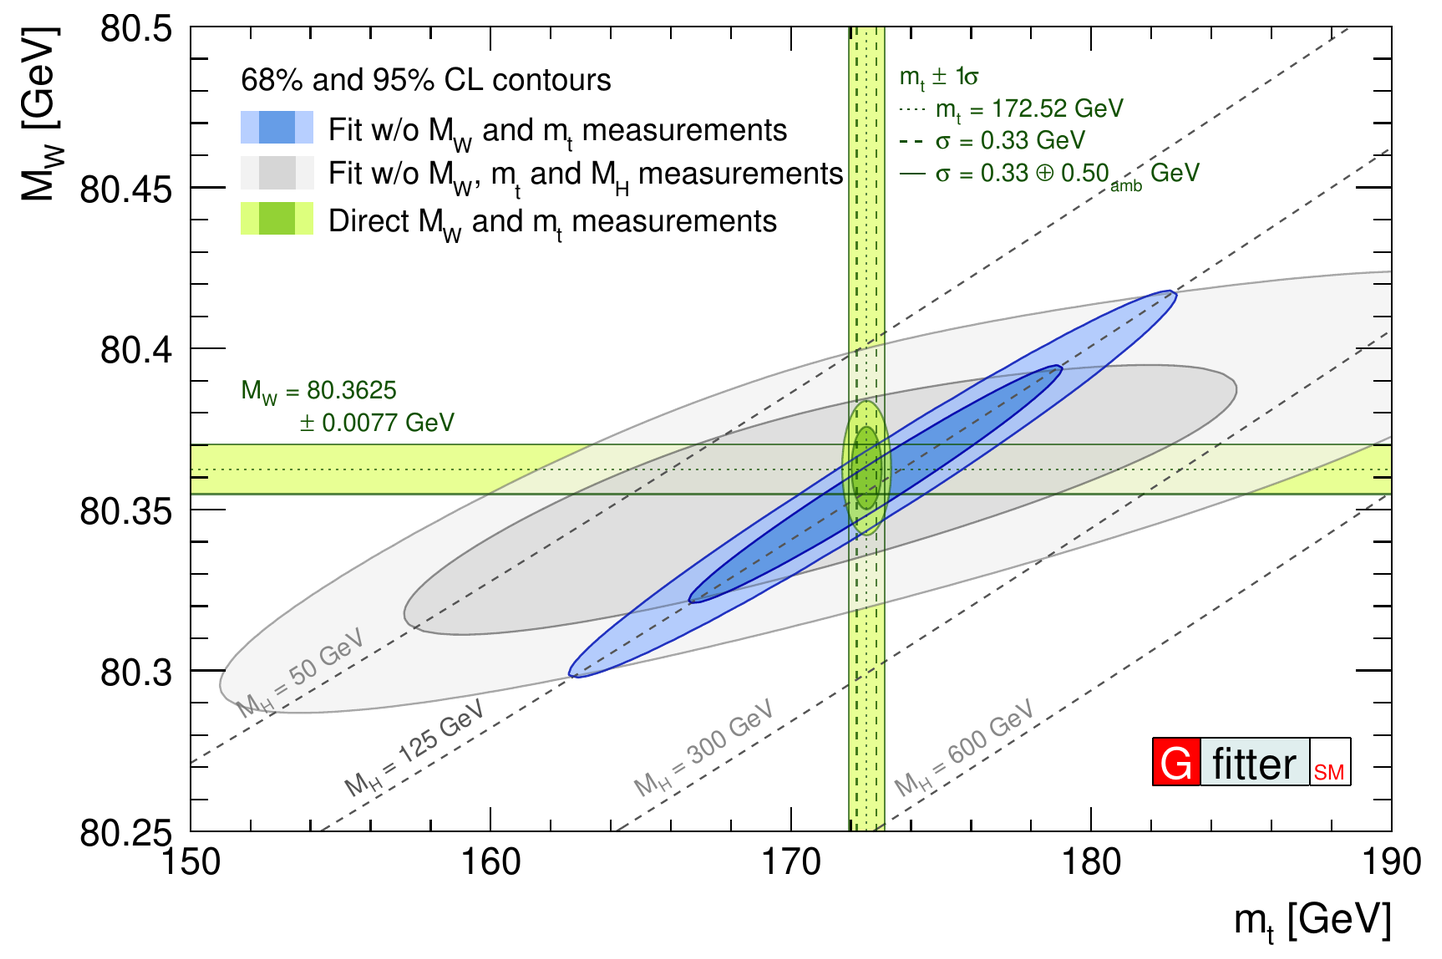
| The same scan in the MW vs. mt plane, with the additional grey contours showing the fit result obtained without using the measured MH, MW and mt as input. The dashed grey lines indicate the SM prediction of MW as a function of mt for fixed values of MH. |
 .pdf
.pdf
|
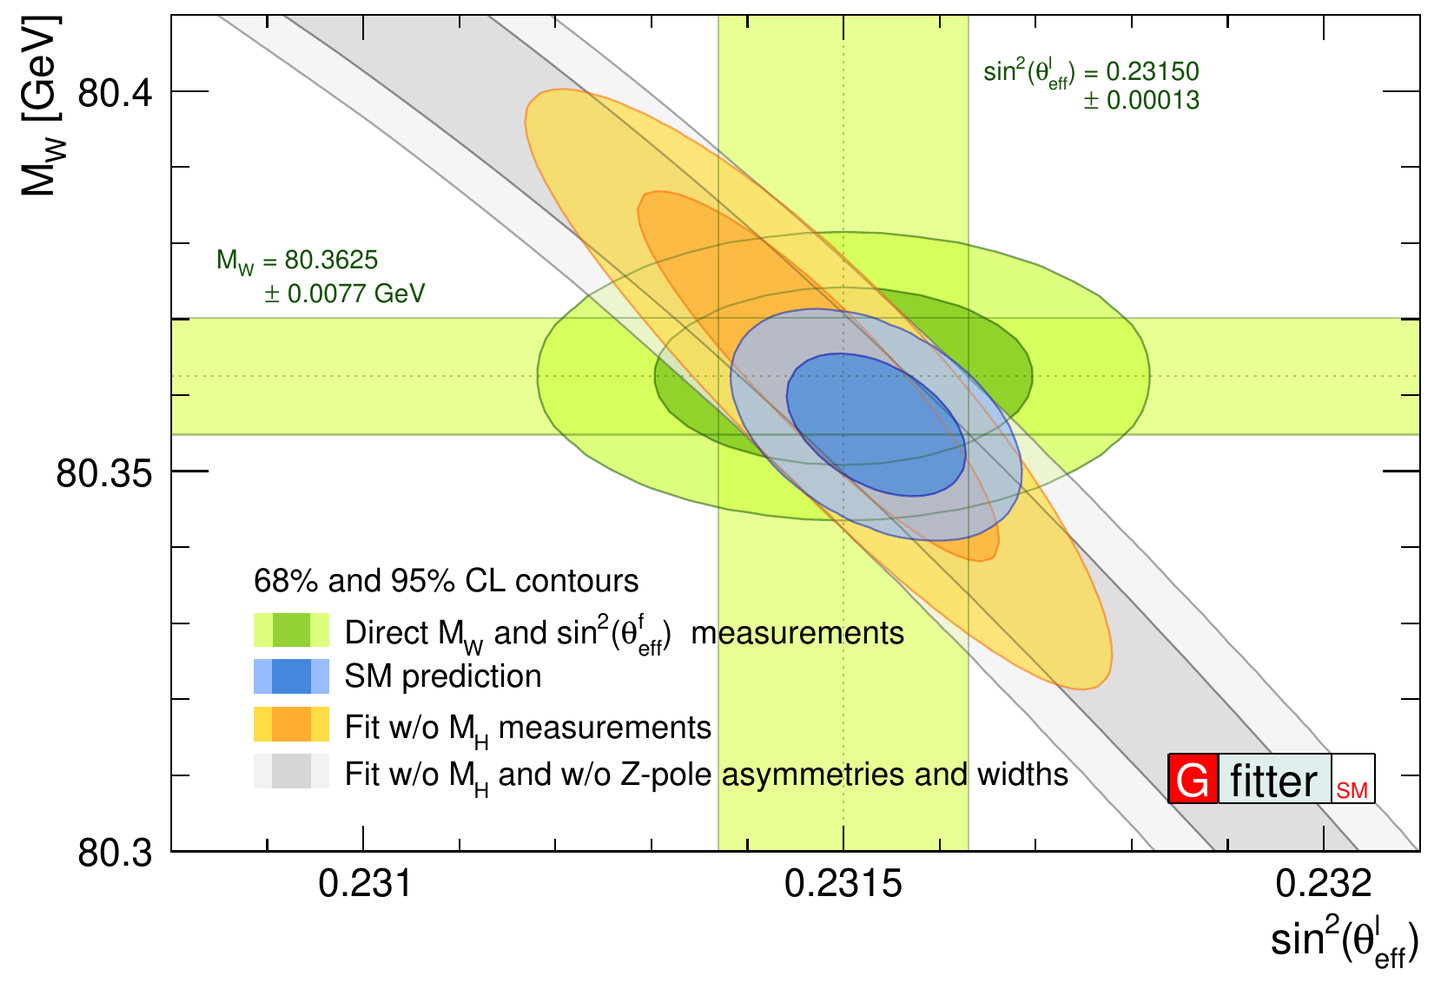
| Contours of 68% and 95% confidence level in the MW vs. sin2θeffl plane. Shown are the direct MW and sin2θeffl measurements (green), the SM prediction (blue), the fit without the MH measurement (orange), and the fit without MH and without the Z-pole asymmetries and widths (grey). |
 .pdf
.pdf
|
